Unveiling the Power of Heatmaps: Visualizing User Attention
Before your product or service goes live, the pre-launch landing page is a critical opportunity to shape first impressions and drive conversions. Yet traditional analytics—pageviews, bounce rates, and click-throughs—only scratch the surface of visitor behavior. Enter landing page heatmap tools, the visual gurus that transform raw data into intuitive color-coded maps. By revealing exactly where visitors click, scroll, and linger, heatmaps illuminate friction points and hidden strengths. For marketers preparing to launch, leveraging these insights can make the difference between a tepid debut and a resounding success. In a digital ecosystem rife with distractions, heatmaps cut through noise to highlight the areas that capture—and lose—visitor attention.
Mapping Attention Hotspots: The Anatomy of a Heatmap
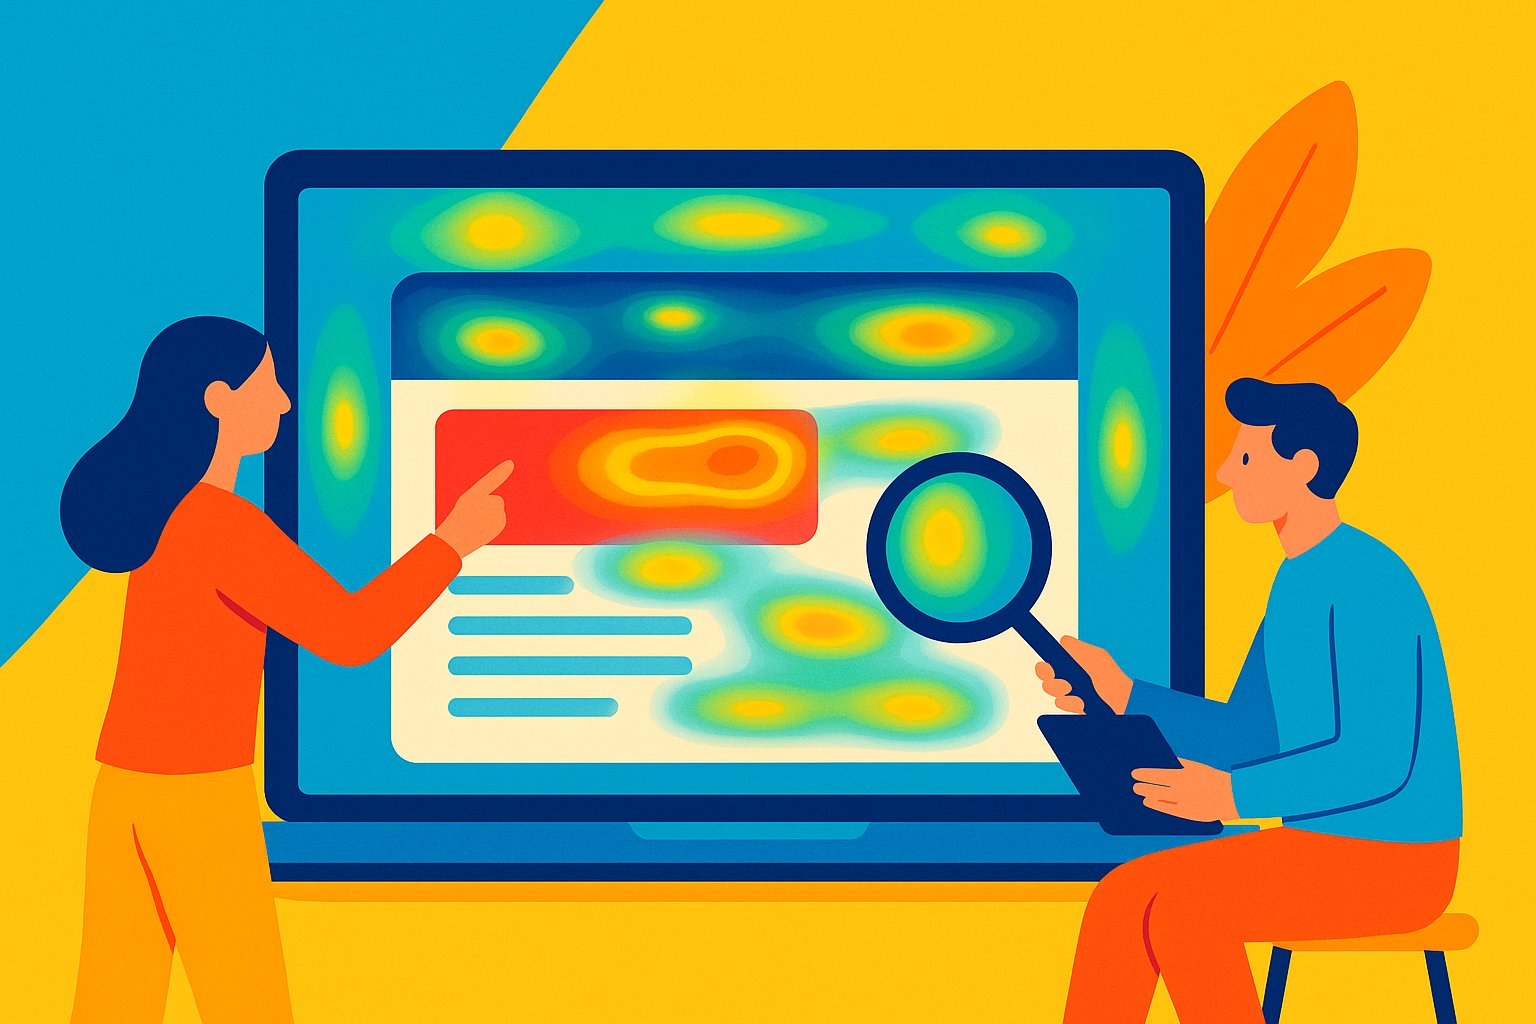
At its core, a heatmap overlays a spectrum of colors onto your landing page, with warm hues indicating high engagement and cooler tones signaling neglect. Scroll maps reveal how far users travel down the page, showing whether essential content resides above or below the fold. Click maps highlight buttons, images, and links that draw the most interaction, while hover maps capture murmurings of interest as visitors pause over specific elements. Together, these visualizations offer a multidimensional view of user behavior. Instead of sifting through spreadsheets of numbers, marketers see patterns at a glance: perhaps a call-to-action button buried beneath a text block, or a testimonial section that seldom registers a glance. Understanding the anatomy of a heatmap is the first step toward optimizing pre-launch conversions.
Spotlight on Leading Solutions: Which Heatmap Tools Shine Bright?
A variety of heatmap tools populate the market, each offering unique strengths tailored to different needs and budgets. Crazy Egg stands out for its straightforward interface and quick setup, enabling teams to launch heatmap tracking with minimal technical overhead. Hotjar combines heatmaps with session recordings and user feedback polls, providing a holistic view of visitor intent and sentiment. Microsoft Clarity’s zero-cost model appeals to startups and small businesses, delivering robust click and scroll maps without straining resources. For enterprise-level operations, FullStory offers granular insights into user journeys, fusing heatmaps with click tracking and advanced funnel analysis. When selecting a tool, consider your team’s technical capacity, the desired granularity of data, and integration potential with existing analytics platforms. The ideal heatmap solution seamlessly aligns with your objectives and scales fluidly as your traffic volume grows.
Key Features to Look For: Beyond Color Gradients
While every heatmap tool visualizes user interactions, robust feature sets distinguish the indispensable from the optional. First, real-time or near-real-time data processing ensures you can iterate rapidly during the critical pre-launch window. If your landing page undergoes daily tweaks, delayed reporting could obscure emerging patterns. Second, customizable heatmap segments allow you to filter based on device type, traffic source, or user demographics. Are mobile visitors scrolling farther than desktop users? Do visitors referred from social media click different elements than those arriving via email? Third, integrated session recordings and user feedback widgets provide qualitative context to quantitative heatmap data. Heatmaps may reveal that a vital signup button goes unnoticed, but session recordings can expose the precise scroll hesitation or visual clutter causing confusion. Lastly, consider the ease of exporting data. CSV reports, API access, or direct integration with Google Analytics ensure that heatmap insights become part of a unified analytics ecosystem rather than isolated dashboards.
Crafting Hypotheses: Turning Visual Clues into Actionable Questions
Data without direction stalls progress. As you analyze heatmaps, approach each visualization with a hypothesis in mind. If a key benefit section consistently falls into a cool zone—indicating low engagement—ask whether its headline lacks punch or whether its positioning fails to capture the visitor’s eye. When visitors repeatedly click on non-interactive elements, consider the possibility that your page design misleads them into expecting a link or button. A sudden spike in engagement around a particular image could suggest that your visuals resonate more than your copy. As you craft hypotheses, document each assumption alongside its corresponding heatmap evidence. This structured approach prevents anecdotal reasoning and fosters a cycle of targeted experimentation: test headline variations, adjust button colors, or reposition testimonials, then compare subsequent heatmaps to validate or refine your theories. By treating heatmaps as a diagnostic tool rather than a mere dashboard, you propel your pre-launch optimization forward.
Real-Time Experimentation: A/B Testing with Heatmap Insights
One of the most potent ways to leverage heatmap tools is by integrating them into your A/B testing workflow. Suppose you suspect that a revamped headline or a relocated signup form might boost conversions. Creating two variants—A and B—allows you to measure not only conversion metrics but also engagement heatmaps in parallel. Imagine Variant A features a static hero image, while Variant B includes an animated background. Traditional metrics might show a marginal uplift in click-through rates, but heatmaps could reveal that the animation draws attention away from the call-to-action, chilling engagement in critical zones. Armed with such insights, you can decide whether to proceed with the animation or revert to a cleaner design. Running A/B tests through a heatmap lens ensures that every iteration centers on actual user behavior, unearthing subtle issues that convert metrics alone might overlook. In a pre-launch scenario, this iterative cycle of testing and refining can compress weeks of guesswork into days of data-driven clarity.
Optimizing for Mobile: Ensuring Seamless Experiences Across Devices
With a growing share of traffic originating from smartphones and tablets, neglecting mobile optimization is a recipe for missed opportunities. Heatmap tools differentiate between desktop, tablet, and mobile data, allowing you to compare engagement patterns side by side. Perhaps mobile visitors frequently tap a hero image—expecting it to expand—while desktop users ignore it entirely. Or maybe your sign-up form appears too far down the page for mobile users to scroll comfortably. When a mobile heatmap shows low scrolling depth, consider condensing content or collapsing long text blocks into expandable sections. If users tap the wrong elements due to tightly spaced buttons, adjust your layout to comply with touch-friendly spacing guidelines. By systematically analyzing heatmaps across devices, you ensure that every visitor—regardless of screen size—experiences a streamlined, intuitive pre-launch journey that drives optimal conversions.
Layering Behavioral Segmentation: Focused Insights for Special Audiences
Not every visitor engages with your landing page in the same way. Traffic sources, demographics, and referral campaigns can significantly influence user behavior. Leading heatmap tools offer segmentation features that let you isolate heatmap data by specific cohorts. For instance, filter your data to view the heatmap exclusively for visitors arriving from a Facebook ad campaign. Do they skip over your value propositions and head straight for the signup form? Or do they linger on social proof sections? Similarly, segmenting by geographic region might reveal cultural preferences influencing interactions—perhaps European visitors respond more to certain testimonials than those from North America. By layering these behavioral segments, you unlock micro-level insights that empower hyper-targeted optimizations. Tailoring page elements to distinct audiences ensures that your landing page resonates across diverse visitor profiles, maximizing conversion rates before launch day.
Integrating Heatmaps with Analytics Platforms: A Unified Data Ecosystem
Heatmap tools deliver eye-opening visualizations, but their impact multiplies when integrated with broader analytics ecosystems. Many heatmap solutions seamlessly connect with Google Analytics, allowing you to correlate heatmap observations with traffic sources, goal conversions, and user demographics. If Google Analytics reveals a high bounce rate from mobile users, you can dive directly into the mobile heatmap to diagnose the root causes. Conversely, heatmap findings—such as a frequently ignored signup button—can prompt adjustments in your UTM-tagged paid campaigns, refining audience targeting or ad creatives. Integrating with customer journey analytics or CRM systems can extend these insights further. Imagine heatmaps flagging a confusing form field; once resolved, you track in your CRM whether pre-launch leads from that form exhibit higher purchase rates post-launch. By weaving heatmap data into your overarching analytics fabric, you transform segmented observations into orchestrated strategies that optimize performance at every funnel stage.
Translating Heatmap Insights into Action: From Data to Launch-Day Wins
Collecting heatmap data is only half the battle; the true power lies in implementing actionable changes. Begin by prioritizing optimizations based on potential impact and feasibility. If a heatmap exposes a critical call-to-action button that rarely receives clicks, prioritize repositioning or restyling that element. If testimonials at the bottom of the page languish unseen, experiment with elevating them higher or substituting more compelling social proof like short video clips of user endorsements. Document each change in a shared repository, noting pre- and post-adjustment metrics for accountability. Encourage collaboration among designers, copywriters, and developers to ensure that insights translate into swift, cohesive updates. In the days leading up to your launch, schedule multiple rounds of micro-iterations: tweak, monitor, and refine. By systematically applying heatmap revelations, you build a landing page that captivates attention and guides visitors seamlessly to conversion—setting the stage for a triumphant debut.
Beyond the Pre-Launch: Heatmap Strategies for Post-Launch Success
While this guide focuses on pre-launch optimization, heatmap tools continue to deliver value well past your launch date. As traffic surges and your audience diversifies, heatmap analysis highlights emerging trends and shifting behaviors. Perhaps post-launch features or pricing tables draw unexpected attention, signaling new areas for content expansion or A/B testing. Or maybe heatmaps reveal that returning visitors navigate directly to a particular section—hinting at the need for a dedicated content hub or knowledge base. By maintaining a continuous feedback loop between heatmap insights and UX enhancements, you ensure that your landing page and broader website evolve hand in hand with audience expectations. Embracing heatmap-driven iteration transforms your pre-launch investment into a long-term growth engine, fueling higher engagement and sustained conversions as market dynamics evolve.
Crafting a Data-Driven Launch Blueprint: Your Next Steps
Landing page heatmap tools offer an unparalleled window into real user behavior—insights that can turbocharge your conversion rates and sharpen your competitive edge. As you prepare for launch, the roadmap is clear: select a heatmap solution aligned with your objectives; establish clear tracking parameters and device-specific segments; craft hypotheses and run A/B tests; and integrate heatmap findings with your broader analytics framework. Each step propels you closer to a landing page optimized not by intuition, but by tangible evidence of what resonates most with visitors. By anchoring your pre-launch strategy in heatmap analytics, you minimize guesswork, prioritize high-impact changes, and ensure that when your product or service goes live, every click, scroll, and hover drives toward the ultimate goal: conversion. Embrace the heatmap revolution, and watch as your launch-day metrics transform from hopeful projections into realized achievements.