The Foundations of Real Estate Crowdfunding Analysis
In the dynamic realm of real estate crowdfunding, two performance indicators stand above the rest: the cap rate and the cash-on-cash (CoC) return. Both metrics offer investors a window into potential yields, but they capture distinct facets of an opportunity’s risk and reward profile. Cap rate distills a property’s income-generating power relative to its price, providing a standardized yield measure. Cash-on-cash return, by contrast, focuses on actual cash distributions relative to invested equity, highlighting immediate income potential. For crowdfunding investors—who often evaluate dozens of deals online without physically visiting properties—grasping these metrics is essential. They equip you to filter opportunities efficiently, compare diverse deal structures, and align your investments with personal goals.
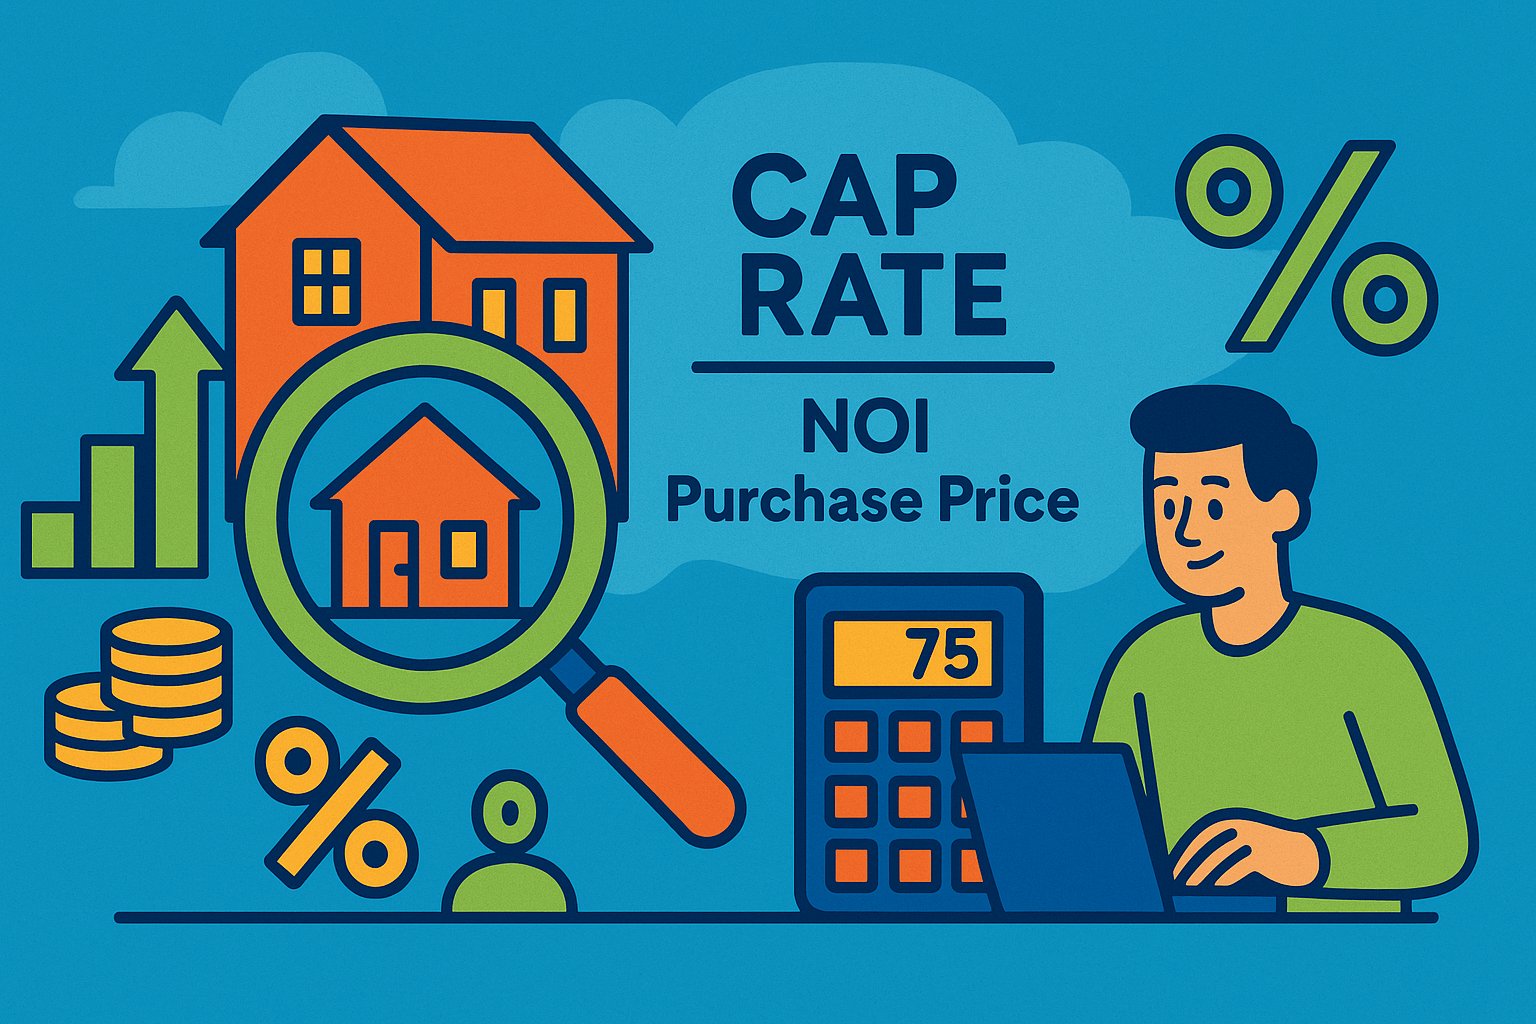
Decoding Cap Rate: The Income Yield Indicator
The capitalization rate, or cap rate, represents the ratio of a property’s Net Operating Income (NOI) to its market value or purchase price. NOI encompasses gross rental income plus ancillary revenues, minus operating expenses such as property management fees, insurance, taxes, and maintenance reserves. Dividing NOI by the asset’s cost yields the cap rate: a simple percentage that signals the unleveraged income yield you might expect in a stabilized year. In crowdfunding deal listings, sponsors typically publish projected NOI and valuation figures, enabling you to calculate or verify the cap rate yourself. Because cap rates normalize yields across different markets and property types, they serve as a universal benchmark for quickly triaging high-yield listings and spotting potential red flags when a cap rate deviates significantly from regional norms.
Demystifying Cash-on-Cash Return: The Equity Income Lens
While cap rate measures unleveraged income yield, the cash-on-cash return zeroes in on the equity investor’s reality: the ratio of actual cash distributions to the initial equity investment. In crowdfunded projects, investors often contribute only a portion of the total capital stack—equity sits alongside debt financing. Cash-on-cash return reveals the annualized cash yield you receive on that equity contribution, factoring in financing costs. For example, if you invest $50,000 in equity and receive $5,000 in cash distributions over a year, your CoC return is 10 percent. Unlike cap rate, CoC return directly reflects debt servicing impacts and distribution policies, making it invaluable for investors prioritizing immediate income over long-term appreciation.
Calculating Cap Rate and CoC Return: A Practical Walkthrough
Accurate metric calculation starts with a robust cash flow model. For cap rate, gather projected gross revenues and subtract operating expenses to derive NOI. Divide NOI by the property’s acquisition price or current valuation. For cash-on-cash return, determine the equity portion of the capital stack—subtract total debt from the purchase price to isolate equity. Then, sum all cash distributions paid to equity investors during the year—interest, dividends, and partial return of capital—and divide by initial equity invested. Ensuring consistency in timing—whether you annualize quarterly payments or pro-rate mid-year entries—prevents distortions. Many crowdfunding platforms offer downloadable cash flow schedules formatted for direct import into spreadsheets, but manually verifying assumptions deepens your understanding and safeguards against black-box errors.
Why Cap Rate and CoC Return Tell Different Stories
Cap rate and cash-on-cash return each illuminate different dimensions of deal performance. A high cap rate often signals a property priced at a relative discount or operating in a secondary market with higher income yields, yet without leverage, the metric masks financing effects. Conversely, a strong CoC return can result from modest cap rates amplified by high leverage—flipping the narrative on risk. Heavy borrowing can boost cash-on-cash yields but also magnify vulnerability to rising interest rates or income shortfalls. By viewing both metrics side by side, investors understand the raw income potential of an asset (cap rate) and the actual cash yield on their equity (CoC return), allowing for nuanced risk-reward trade-offs in portfolio construction.
Interpreting Market Context: Benchmarking Cap Rates and CoC Returns
Real estate markets exhibit stark differences in cap rates and financing terms. In competitive coastal metros, stabilized multifamily properties may trade at sub-5 percent cap rates, whereas affordable suburban rentals yield 7 to 9 percent. Similarly, lenders in primary markets might offer 70 percent loan-to-value (LTV) at low interest, compressing CoC returns, while secondary markets require higher equity down payments but deliver stronger cash distributions. Crowdfunding platforms often publish regional benchmarks—average cap rates and typical debt terms—enabling you to contextualize deal metrics. Benchmarking against these norms helps detect outliers: a 4 percent cap rate in a market averaging 6 percent could reflect unsustainable valuation, while a promised 15 percent CoC return might hinge on aggressive leverage that heightens execution risk.
Risk Dynamics Through the Lens of Cap Rate
Cap rates offer a window into underlying risk factors. Lower cap rates generally correspond with premium, stabilized assets in strong markets, implying lower vacancy risk and more predictable cash flows. Higher cap rates can indicate secondary locations, value-add opportunities, or distressed properties. While the latter often promise better raw yields, they expose investors to execution risk—renovation delays, cost overruns, or weaker tenant demand. In equity-based crowdfunding, value-add sponsors may target a high cap rate gap (the difference between current and stabilized cap rates) as compensation for project risk. Understanding cap rate drivers—market fundamentals, asset condition, and sponsor expertise—enables you to calibrate acceptable risk thresholds for each investment.
Income Realities Through the Lens of Cash-on-Cash Return
Cash-on-cash return reveals how financing shapes investor cash flows. A heavily leveraged deal can turn a 6 percent cap rate into a 12 percent CoC yield, provided interest rates remain fixed. Yet this upside leverage also heightens sensitivity to interest rate movements and debt covenants. If rental income dips or rates reset upward, cash-on-cash returns can evaporate or even flip negative. Conversely, lower-leverage strategies yield steadier CoC returns but may underutilize the sponsor’s borrowing capacity. By modeling CoC return under various financing scenarios—fixed versus floating-rate loans, different amortization schedules—you grasp how financing structures mediate risk and reward, informing your choice of equity-only versus debt-hybrid crowdfunding offerings.
Aligning Metrics with Investment Goals
Your personal objectives—whether prioritizing immediate income, total wealth accumulation, or capital preservation—dictate which metric carries more weight. Income-focused investors rely heavily on cash-on-cash return to meet cash flow needs, favoring deals with predictable, periodic distributions. Growth-oriented participants may lean toward cap rate, targeting properties with strong income fundamentals and potential appreciation at exit, even if initial cash flows are modest. Balanced investors integrate both: they screen deals for minimum cap rate thresholds to ensure baseline income stability, then evaluate CoC returns to verify that financing amplifies distributions within acceptable risk parameters. Clear goal definition transforms cap rate and CoC analysis from academic exercises into practical decision tools.
Timing and Distribution Smoothing: Impact on CoC Yield
Cash distribution schedules vary widely in crowdfunding. Quarterly dividends deliver frequent cash flows, bolstering annual CoC yield calculations. Some deals front-load preferred returns, paying higher yields in early periods before ramping down. Others accrue dividends and pay only at exit, compressing interim CoC returns to zero but augmenting total equity multiples. Recognizing distribution timing is critical: a project paying 8 percent over two years but with no interim payments yields a near-zero annual CoC return—despite aggressive IRR projections. Always map distribution schedules and annualize them appropriately to avoid misinterpreting delayed cash flows as lackluster CoC performance.
Fee Structures and Their Effect on Metrics
Fees quietly erode both cap rate and cash-on-cash yields. Acquisition fees reduce the effective purchase price but also divert capital away from income generation until recouped. Asset management fees and performance fees carve into NOI, lowering cap rate calculations if included in expense lines. Disposition and refinancing fees diminish exit proceeds, cutting both cap and cash-on-cash returns. Sponsors and platforms should disclose all fee schedules prospectively; as an investor, quantify total expense ratios and subtract these from your NOI and CoC models. Comparing net cap rates and net CoC returns—after all fees—ensures you evaluate deal economics transparently and avoid surprises upon distribution.
Stress-Testing Metrics: Preparing for Market Shocks
Markets fluctuate, and no projection holds under all conditions. Stress-testing cap rates involves modeling lower NOI scenarios—such as 10 percent rental downturns or higher vacancy rates—to see how yields shift. A resilient deal might still trade at a 6 percent cap under stress, while a marginal play could slip into negative cash flow. Similarly, stress-testing CoC returns entails simulating higher interest rates, extended vacancies, or sponsor fee hikes. If a 12 percent projected CoC return falls to 4 percent under moderate stress, the deal may pose unacceptable risk. Platforms that provide built-in sensitivity analyses—or allow you to tweak assumptions interactively—empower more robust metric evaluation, guiding you away from brittle deals.
Real-World Case Study: Metrics in Action
Consider two crowdfunded multifamily offerings: Property A trades at a 5 percent cap rate with 60 percent LTV financing at 4 percent interest, resulting in a 9 percent cash-on-cash return. Property B lists at an 8 percent cap rate with no leverage, delivering an 8 percent CoC yield. Property A promises faster capital turnover through dividend distributions but carries refinancing risk if rates spike. Property B offers simpler risk dynamics and pure income yield but forgoes leverage amplification. By comparing cap rate and CoC metrics side by side—and overlaying risk preferences—you determine whether you prefer leveraged income efficiency or unleveraged simplicity, aligning deployment decisions with your strategic compass.
Portfolio Construction: Balancing Cap Rate and CoC Exposures
Sophisticated investors build portfolios that blend high-cap-rate, unleveraged assets with leveraged, high CoC opportunities. This diversification smooths cash flows and moderates volatility: unleveraged core holdings anchor stable yields, while leveraged value-add plays boost overall portfolio income. Crowdfunding platforms increasingly offer model portfolios or basket investments that automate this balance, combining deals across cap and CoC spectra. As you accumulate multiple investments, track portfolio-level weighted average cap rates and cash-on-cash returns, ensuring your aggregate metrics align with your target return and risk profile. Periodic rebalancing—redeploying matured capital from one metric bucket to another—maintains strategic equilibrium.
Avoiding Common Metric Pitfalls
Beginners often misapply metrics. A single-year cap rate may ignore deferred maintenance reserves, overstating yield. Cash-on-cash return can exaggerate income if early distributions aren’t annualized correctly. Comparing cap rate of an unleveraged deal to CoC of a leveraged deal without reconciling financing differences misleads. Furthermore, neglecting fees or assuming fixed financing terms can distort both metrics. To avoid these traps, always verify NOI inclusiveness, standardize CoC annualization, compare metrics within similar deal structures, and model financing variances explicitly. A methodical, disciplined approach ensures your metric-driven decisions rest on accurate, comparable foundations.
Technology and Tools: Streamlining Metric Analysis
Modern crowdfunding platforms and investment software increasingly integrate cap rate and cash-on-cash calculators directly into deal listings, allowing you to adjust financing terms and expense assumptions on the fly. Advanced dashboards visualize metric sensitivity to rate hikes or expense shifts, while mobile apps push performance alerts if actual distributions diverge from projections. Some tools even aggregate your entire portfolio, computing weighted average cap rates and CoC returns in real time. Embracing these technologies accelerates your metric analysis, frees you from manual spreadsheet drudgery, and surfaces insights that inform faster, more confident investment decisions.
Mastering the Dual Metrics for Crowdfunding Success
Cap rate and cash-on-cash return each illuminate vital aspects of real estate crowdfunding returns: the former reveals an asset’s raw income-generating power, while the latter translates financing structures into tangible equity yields. By mastering both metrics—calculating them accurately, contextualizing them within market benchmarks, stress-testing under adverse scenarios, and weaving them into diversified portfolios—you gain the analytical edge crucial for discerning between myriad crowdfunding opportunities. Anchored by cap rate’s universal yield measure and guided by cash-on-cash’s income realism, you evolve into a sophisticated investor, equipped to navigate the nuances of property crowdfunding and build a resilient, high-performing real estate portfolio.